The Background
In industrial intralogistics, the optimization of picking processes is a key factor in the efficiency of companies. On the basis of the specification from the production pickers create – in many cases manually – the range of goods. This work often involves inefficient schedules, physical strain on staff and thus increased costs. Therefore, it is important to create efficient workflows through process optimization in industrial order picking.
So far, the traditional approaches for this purpose are the manual determination of performance data and the evaluation of already existing process data, e.g. by scanning the goods and goods carriers. These methods are usually time consuming, inaccurate and difficult to automate.
The Telocate Analytics solution
The Telocate solution, the Analytics platform, provides automated process monitoring and analysis in order picking. It offers the following benefits for your intralogistics picking process:
- Consistent tracking of the picking process, also between the picks
- Splitting a pick sequence into activities (such as picking, walking, dropping, disposal, downtime)
- Creating a basis for MTM modeling (Methods-Time Measurement)
- Analysis of development over time periods, e.g. comparison of weekdays and shifts, learning curve of new employees, effects of reorganization
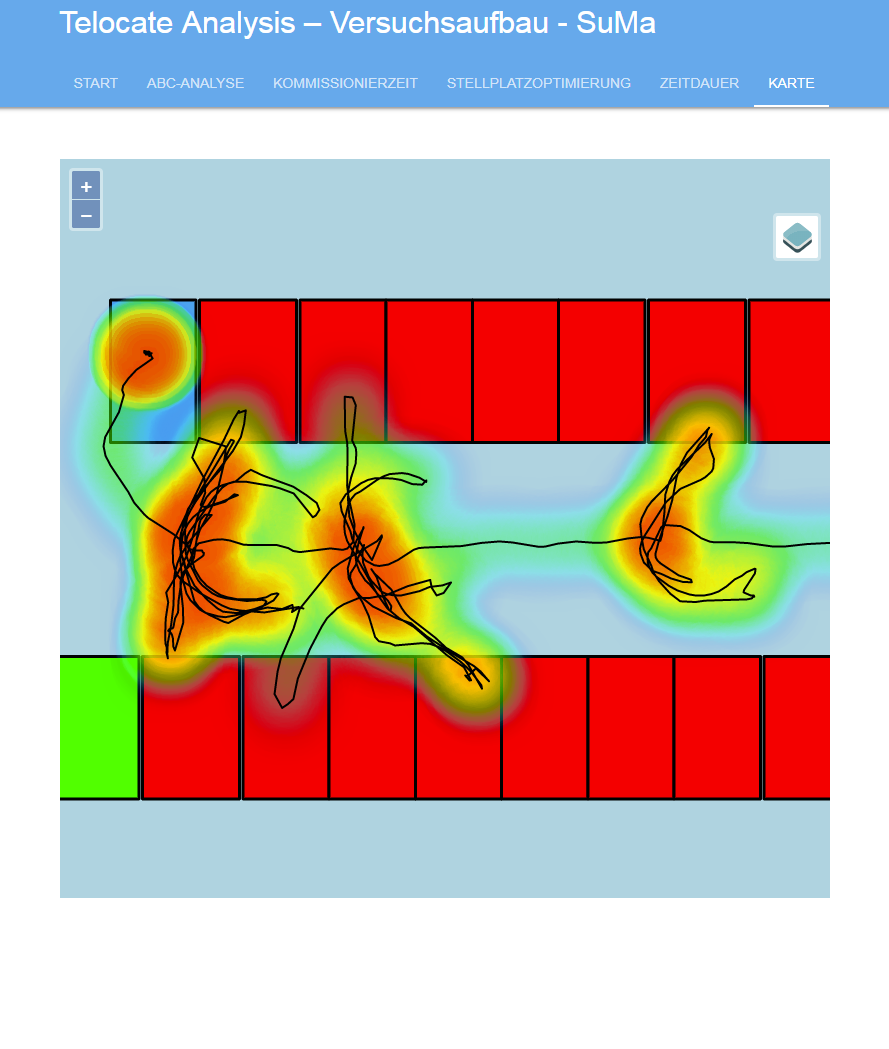
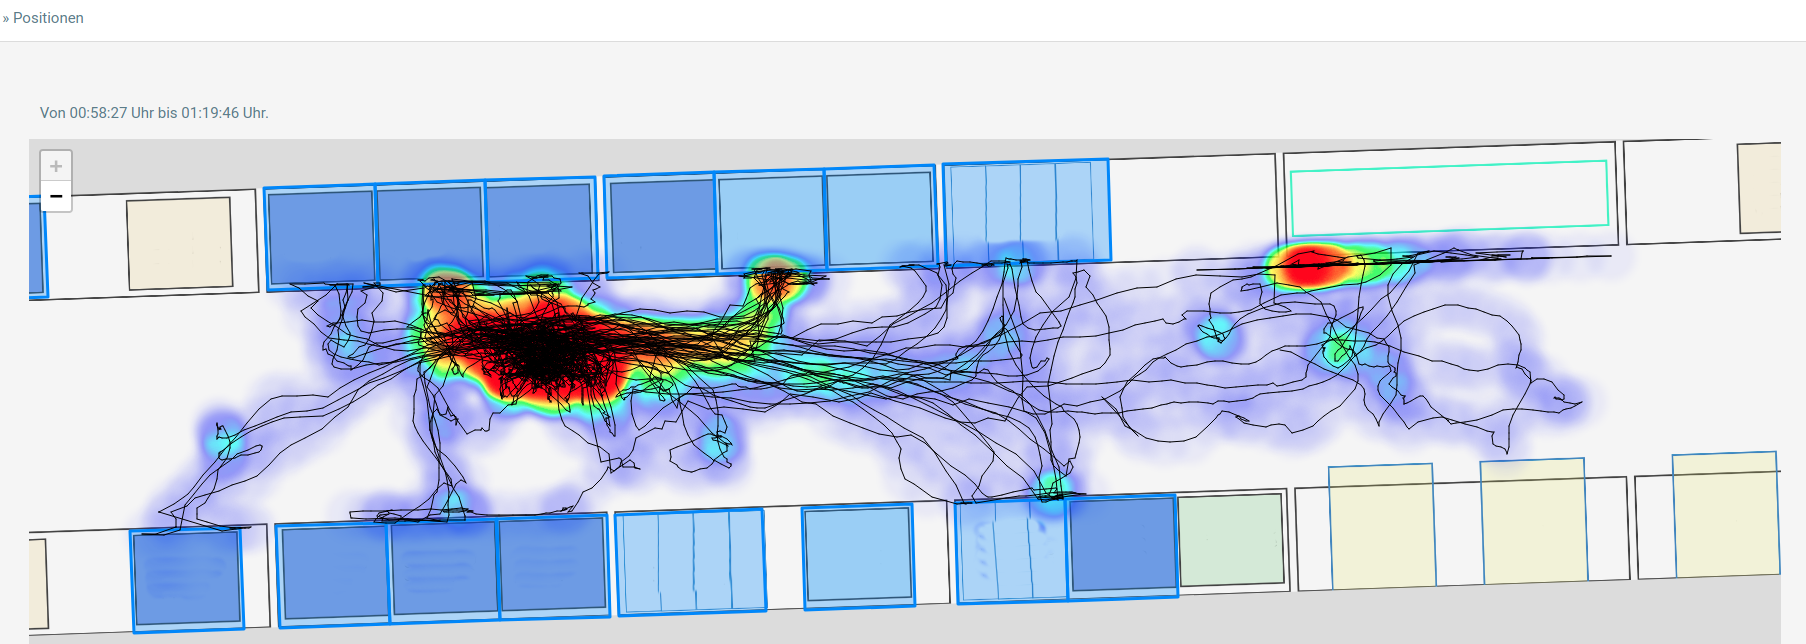
The data collection is done by the novel Telocate developed Wave technology. The Telocate Wave tag transmits inaudible, harmless ultrasonic pulses that are recorded by acoustic receivers. A Telocate Wave tag is attached to the person, e.g. on a headset or clothes. The system can reliably detect goods box accesses up to a unit size of 30 cm.
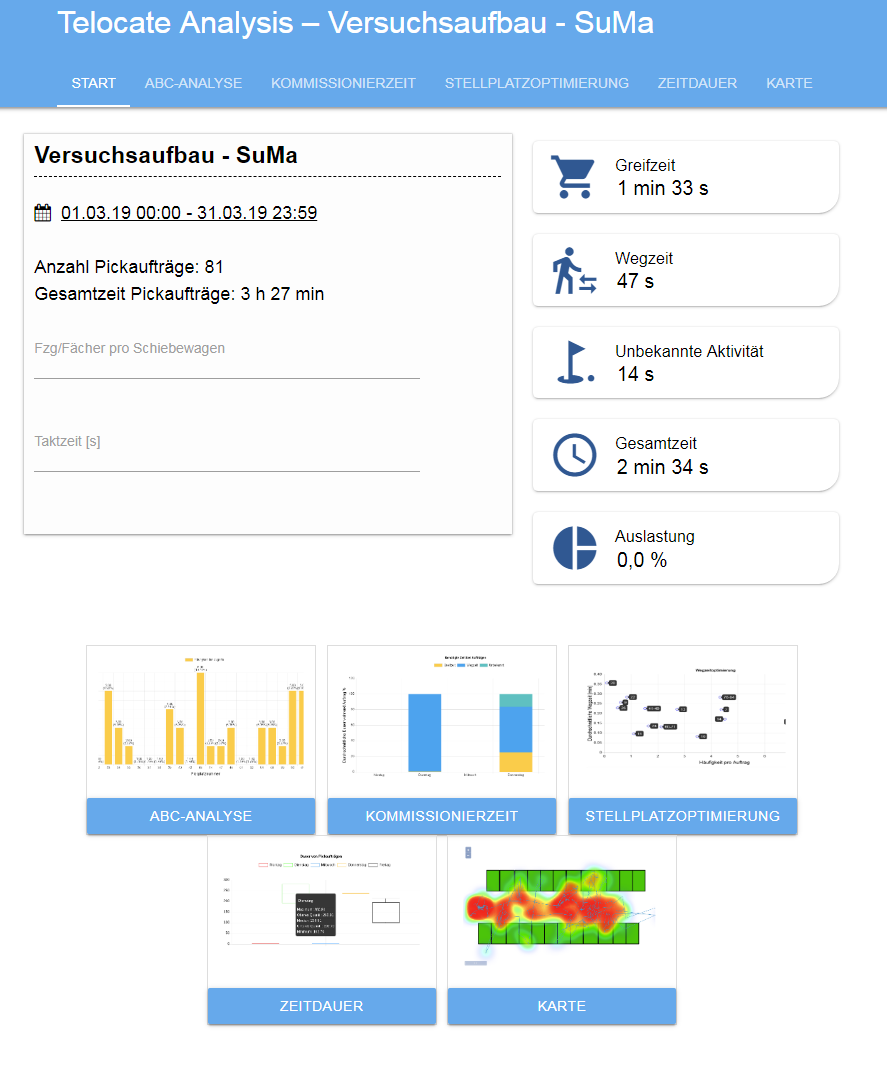
The web application
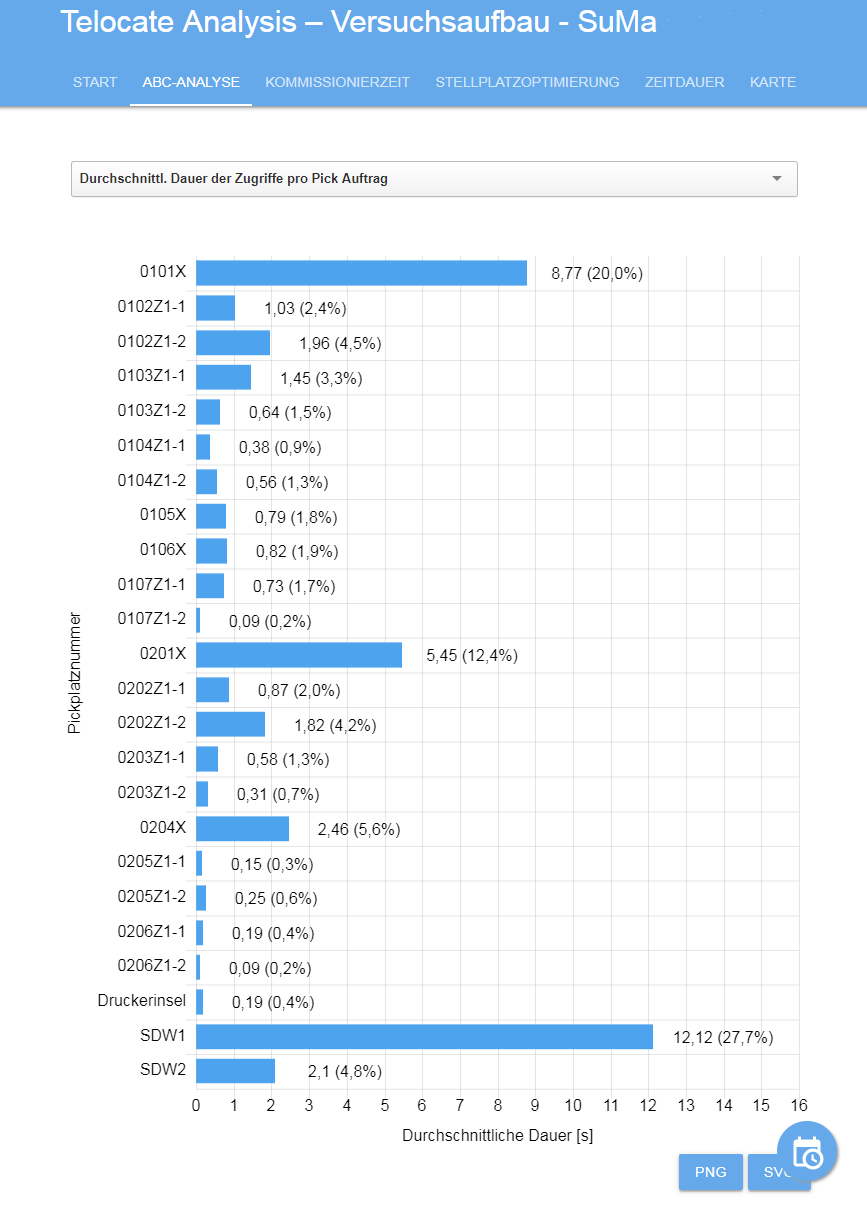
Event detection is done by defining zones in the Analytics web application, such as shelf locations or the outlines of goods boxes. The statistical analysis allows a detailed breakdown of the process performance parameters, such as the frequency and duration of access or the length and duration of distances traveled between picking locations, or non-productive distribution times. These can be clearly grouped according to single or multiple picking orders.